OCS (orb 12, P/E1) ePS bond-scan processing
16/05/23 PH
This notebook: results for orb12 (HOMO) bond-scan runs (ongoing).
For previous results (inc. AF) see: https://phockett.github.io/ePSdata/OCS-preliminary/OCS_orbs8-11_AFBLMs_VM-ADMs_140122-JAKE_tidy-replot-200722_v5.html
For methods: https://epsproc.readthedocs.io/en/dev/demos/ePSproc_class_demo_161020.html
Setup
!hostname
!conda env list
import sys
import os
from pathlib import Path
import numpy as np
# import epsproc as ep
import xarray as xr
import matplotlib.pyplot as plt
from datetime import datetime as dt
timeString = dt.now()
import epsproc as ep
# Plotters
from epsproc.plot import hvPlotters
# Multijob class dev code
from epsproc.classes.multiJob import ePSmultiJob
hvPlotters.setPlotters(width = 700, snsStyle='whitegrid')


# For class, above settings don't take, not sure why, something to do with namespaces/calling sequence?
# Overriding snsStyle does work however... although NOT CONSISTENTLY????
# AH, looks like ordering matters - set_style LAST (.set seems to override)
import seaborn as sns
sns.set(rc={'figure.figsize':(10,6)}) # Set figure size in inches
sns.set_context("paper")
sns.set_style("whitegrid") # Set plot style
sns.set_palette("Paired") # Set colour mapping
# Try direct fig type setting for PDF output figs
from IPython.display import set_matplotlib_formats
# set_matplotlib_formats('png', 'pdf')
set_matplotlib_formats('svg', 'pdf')
# xr.set_options(display_style='html')
Load data
import warnings
# warnings.filterwarnings('once') # Skip repeated numpy deprecation warnings in current build (xr15 env)
warnings.filterwarnings('ignore') # Skip repeated numpy deprecation warnings in current build (xr15 env)
# # Scan for subdirs, based on existing routine in getFiles()
# fileBase = Path('/home/paul/ePS/OCS/OCS_survey') # Data dir on Stimpy
fileBase = Path('/mnt/fockSSHFS/globalhome/eps/OCS/OCS_bondscan_test') # Fock data dir mounted on Jake
# TODO: fix orb label here, currently relies on (different) fixed format
data = ePSmultiJob(fileBase, verbose = 0)
data.scanFiles()
data.jobsSummary()
# Resort data by key
sortedData = dict(sorted(data.data.items()))
data.data = sortedData
# Fix labels for plots
for key in data.data.keys():
# Label with bond %age change
data.data[key]['jobNotes']['orbLabel'] = key.split('_')[-1].strip('bond').replace('-','',1)
# Set keys for orb
plotKeys = [k for k in data.data.keys() if k.startswith('orb12')]
System properties (bond scan)
Table below shows calcs for 'PC', which is %age change from equilibrium case. Note this shifts both bond lengths by this %age.
# Collect bond scan data from individual datasets...
# STATUS: OUTPUTTING TO PD REF TABLE OK, code messy.
diffDict = {}
IPDict = {}
IParray = []
for n,key in enumerate(plotKeys):
label = key
PC = key.split('_')[-1].strip('bond').replace('-','',1) # Use replace to strip only single '-' and keep -ve values
orb = key.split('_')[0].strip('orb')
atomTable = data.data[key]['XS'].molInfo['atomTable'] #.diff('atom') # Diff works, but not in correct order!
diffs = np.abs(atomTable.sel(atom=3,props='z') - atomTable.sel(props='z')[0:2])
diffs['bonds']=('atom',['CS','CO'])
IParray.append([orb, -data.data[key]['XS'].orbInfo['orbIP'][0], float(PC), *diffs.data])
import pandas as pd
IPtab = pd.DataFrame(IParray, columns=['orb','IP/eV','PC (% bond shift)','C-S/angs.','C-O/angs.'])
display(IPtab)
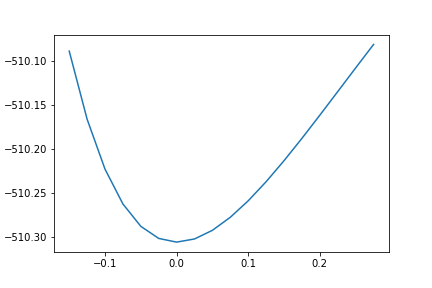
IPtab.plot(y='IP/eV',x='PC (% bond shift)')
Reference plot (Gamess) - total energy (H) vs. PC
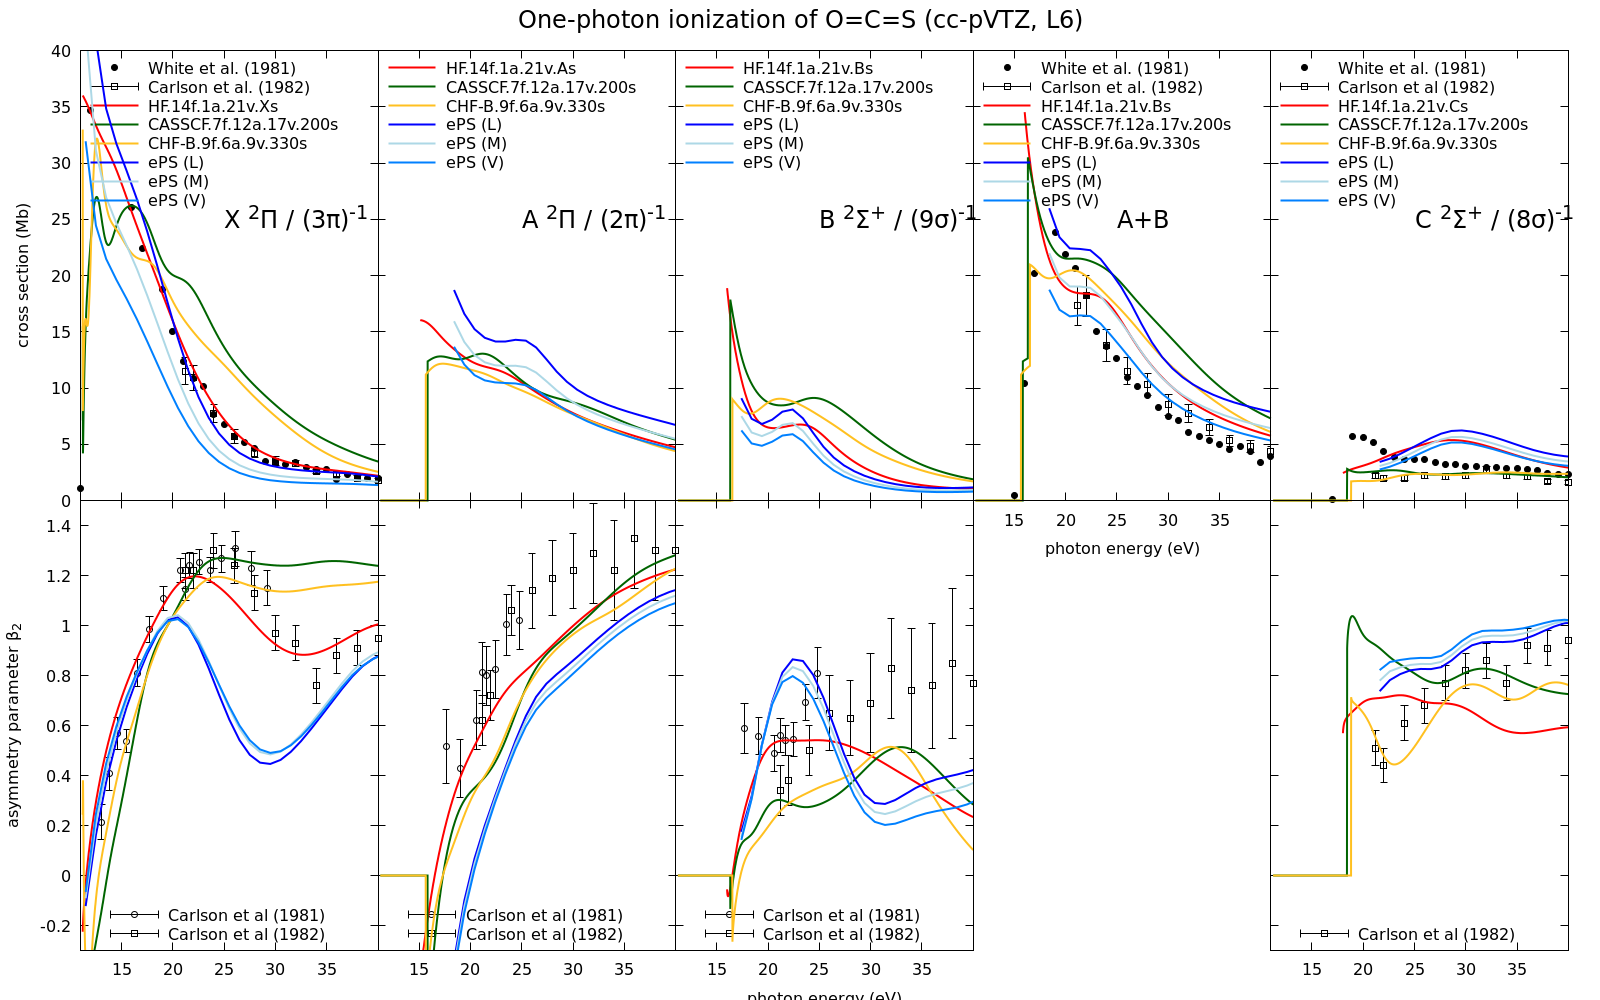
Plot cross-sections and betas
These are from ePolyScat's getCro function, and are LF (unaligned ensemble) results. This provides a good, if general, overview.
Overview (all symmetries, length gauge)
# NEED TO SET AGAIN AFTER CLASS IMPORT!
import warnings
# warnings.filterwarnings('once') # Skip repeated numpy deprecation warnings in current build (xr15 env)
warnings.filterwarnings('ignore') # Skip repeated numpy deprecation warnings in current build (xr15 env)
# Comparitive plot over datasets (all symmetries only)
Etype = 'Eke' # Set for Eke or Ehv energy scale
pGauge = 'L'
# Erange=[0, 100] # Plot range (full range if not passed to function below)
# data.plotGetCroComp(pType='SIGMA', Etype = Etype, Erange = Erange, backend = 'hv')
data.plotGetCroComp(keys = plotKeys, pType='SIGMA', pGauge = pGauge, Etype = Etype)
# data.plotGetCroComp(keys = plotKeys, pGauge = pGauge, Etype = Etype, backend='hv')
# Comparative plot over datasets (all symmetries only)
data.plotGetCroComp(keys = plotKeys, pType='BETA', Etype=Etype)
Cf. reference plot - looks like a slightly extended structure matches the experimental data better for both low-E XS, and betas, for the X-state case, something on the order of ~15 - 20% longer bonds than equilibrium case.
$\beta$ comparison plots
exptDataPath = Path('~/ePS/OCS/epsman2021/data-replot_R-mat_comp_120822/OCS-Rmatrix-results-220808-v3_120523/measurements/')
!ls {exptDataPath}
# Min/max betas
carlsonXBeta = pd.read_csv(Path(exptDataPath,'Carlson-beta-X.txt'), header=None,
names=['E','BetaMin','BetaMax'], delimiter=' ', index_col='E')
# All data, split by type and with uncertainties
carlson1982 = pd.read_csv(Path(exptDataPath,'Carlson1982.txt'), header=None, skiprows=2, delimiter=' ')
# header=[0,1], delimiter=' ')
carlson1982 = carlson1982[[0,3,6]] # X state only
carlson1982.columns = ['E', 'Sigma', 'Beta']
# Fix errs - split cols and set data type
carlson1982[['Sigma', 'Serr']] = carlson1982['Sigma'].str.split(' ', expand=True).astype(float)
carlson1982[['Beta', 'Berr']] = carlson1982['Beta'].str.split(' ', expand=True).astype(float)
carlson1982.set_index('E', inplace=True)
betaPlot = data.plotGetCroComp(keys = plotKeys, pType='BETA', Etype='Ehv', returnHandles=True);
ax = plt.gca() # Get current plot to use with Pandas plotter
carlsonXBeta.plot(y='BetaMin', ax=ax, linestyle=':', marker='x', color='black') #, yerr='Err') #, ax=betaPlot[0])
carlsonXBeta.plot(y='BetaMax', ax=ax, linestyle=':', marker='x', color='grey')
carlson1982.plot(y='Beta',yerr='Berr', ax=ax, linestyle=':', marker='o', color='black')
betaPlot[1].extend(['Carlson 1981 (min)', 'Carlson 1981 (max)', 'Carlson 1982'])
plt.legend(betaPlot[1])
All gauges and continua plots
# Betas vs. Gauge
data.plotGetCro(keys = plotKeys, pType='BETA', Etype=Etype)
Versions
# print(data.jobInfo['ePolyScat'][0])
# print('Run: ' + jobInfo['Starting'][0].split('at')[1])
import scooby
scooby.Report(additional=['epsproc', 'xarray', 'jupyter', 'holoviews'])
# Check current Git commit for local ePSproc version
!git -C {Path(ep.__file__).parent} branch
!git -C {Path(ep.__file__).parent} log --format="%H" -n 1
# Check current remote commits
!git ls-remote --heads https://github.com/phockett/ePSproc
Additional notes
16/05/23 PH
Updated for orb12 bond-scan runs (ongoing).
Either fix self.tidyJobs():
- Currently uses
Path(job.hostDefn[job.host]['jobComplete'], job.genFile.stem).as_posix(), which is wrong.
Or write a quick script:
Manual/dev fixes, see http://jake/jupyter/user/paul/doc/tree/ePS/OCS/epsman2023/epsman_Fock-Docker_file-sorting_OCS_190523.ipynb
- File IO in this notebook OK, except for
orb12_bond--0.12case, not sure why.
10/05/23 PH
- Testing bond-scans, running on Fock (via Docker).
- NOTE orb numbering may change with geometry!!! Here orb10/11 is S/A1 case.
- Based on http://jake/jupyter/user/paul/doc/tree/ePS/OCS/epsman2021/OCS_orb11_proc_131221-JAKE.ipynb
- TODO: FILE TIDY, issues with owner from Docker container, need to map container and/or add option to epsman
tidyJobs()functionality.
07/01/22 PH
- Fixed/tested cos^2 values. (Maybe - now matching Reid 2018, but may not be correct in all cases?)
- Updated plotting with HV for BLMs (in dev stage).
Versions
- TIDY version for distribution: https://phockett.github.io/ePSdata/OCS-preliminary/OCS_orb11_proc_131221-JAKE.ipynb
- Previous HOMO results: https://phockett.github.io/ePSdata/OCS-preliminary/OCS_orb11_proc_090621-JAKE.html
- Previous all-orb restuls: https://phockett.github.io/ePSdata/OCS-preliminary/OCS_orbs8-11_AFPAD_preliminary_110621.html
13/12/21 PH
STATUS: basics in place, need to trim code and fix a few things still.
Revisiting AF cases with (hopefully) better match to experimental alignment.
- Add in cos^2(theta) metric.
- Ballpark ADMs assuming Gaussian case.
TODO:
- Fix orb numering issue! (See note below.)
FIXED:
- Note 'it' and 'labels' handling changed in recent versions of ePSproc, and degenerate dim hanling now correct!
09/06/21 PH
Quick look at initial ePS results for orb 11 (HOMO), 2.5eV step size.
TODO:
- Currently AF code fails for Xarray = 0.17, issue with phaseCons setting to coord, sigh.
- AF normalisation not correct here, due to doubly-degenerate state? Summing over 'it' not working correctly either, needs a debug (or missing some settings...?).
- lmPlot() slice and cmapping to fix, in cases of missing/dropped dims, and for clims if possible.
For methods: https://epsproc.readthedocs.io/en/dev/demos/ePSproc_class_demo_161020.html
break